Richmond Fed, Report: A CPI Basket Case
“How can a plethora of individual price changes in the economy be combined into a single number that represents the overall change in the cost of living? When building the Consumer Price Index (CPI), the Bureau of Labor Statistics (BLS) accomplishes this by figuring out (via consumer spending surveys) what a representative basket of consumer goods and services looks like. Notably, as consumer spending patterns change, the composition of this basket changes over time.”
In January, the BLS announced two changes to its CPI basket. These included: (1) a change in the weights to reflect year 2021 consumption patterns — updating from the prior weights based on 2019-2020 patterns; and (2) increasing the frequency of these updates to annual versus every two years.
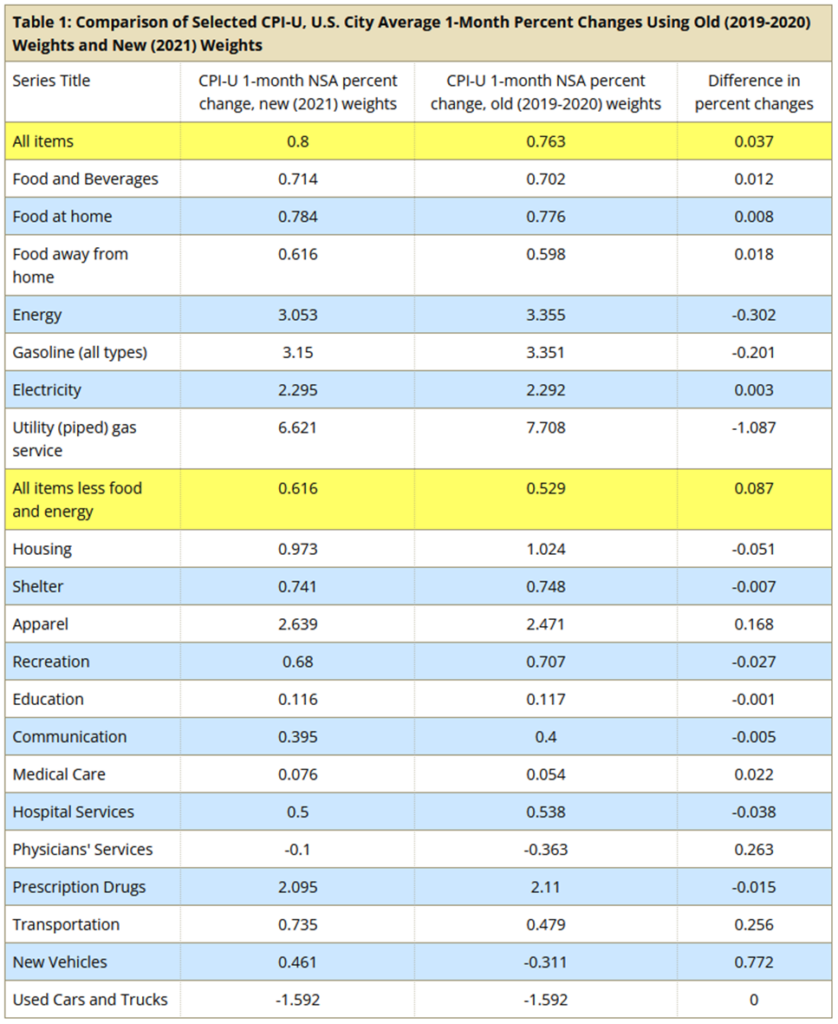
“The BLS also provides a comparison of January month-over-month price growth under the new and old weights. A selection of these is shown in Table 1 below. At the headline level, month-over-month growth rates of CPI are similar using both weighting schemes at about 0.8 percent month-over-month growth (prior to seasonal adjustment).”